2014 YM, ES, NQ and RLM chart summaries
Chart reviews of the end of the week (EOW) and month (EOM) Price Action.
_______________________________________________

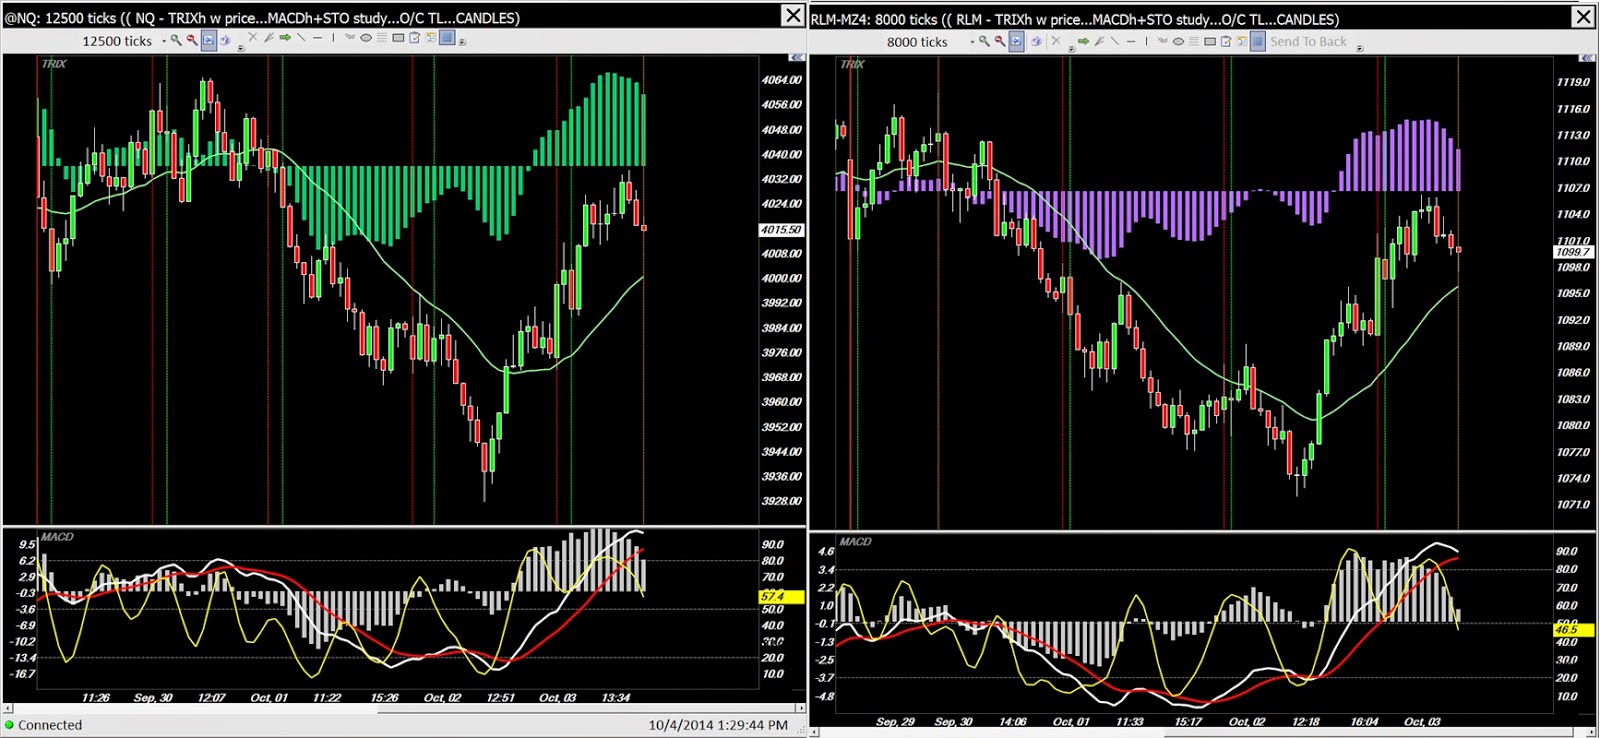
December 12/31/2014 EOM
Ending the month with two down days...the YM and ES closing about where they started ...
The NQ closed lower while the RUT closed higher. All had mid-month swoons.

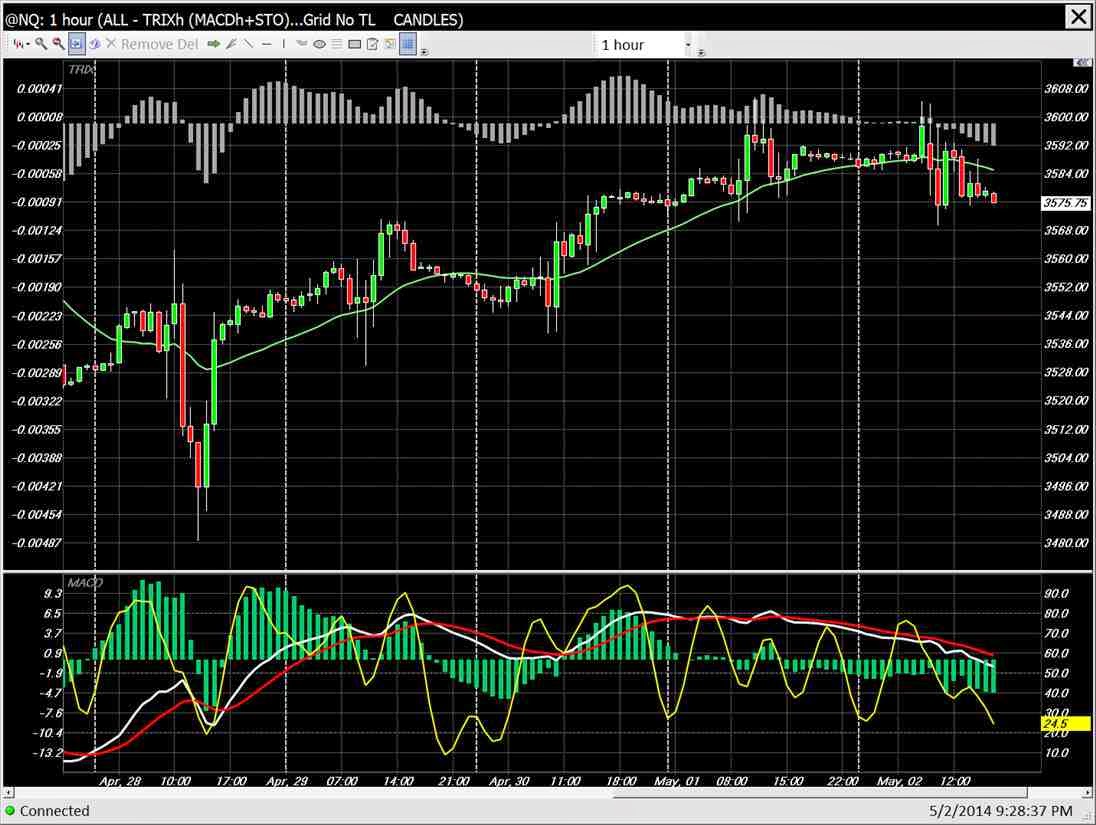
 Here's the 4 hour-per-bar charts:


December 12/19/2014 EOW
Reversed last week's swoon with back-to-back long candles on Wednesday and Thursday.
One hour per bar for the week's sessions over the daily charts


December 12/12/2014 EOW
Trended down all week...This past Friday's close marks the week before OEX...
(12/15/2014 - Had to correct the arrow /date placement for the October turns)

One hour per bar for the week and dailies


December 12/05/2014 EOW
First/Last/Friday B4 OEX chart followed by the 5 day sessions and dailies...pretty much UNCH week-over-week...
(Note: the arrow placements for the turn in October are incorrect - see the corrected charts posted 12/15/2014 above)


November 11/28/2014 EOM
Trended up all month except for the RUT...

.jpg)


November 11/21/2014 EOW
ATHs are still printing except for the RUT...OEX week and there was a bit of volatility, especially Thurs-Fri...
Combined daily and 5-session charts for the 3rd week...


November 11/14/2014 EOW
Combined daily and 5-session charts for the 2st week...
I drew flags on the RUT & NQ and ascending wedges on the YM & ES, correlating to NR7 patterns that formed last Monday.
The NR7 was suggesting a reversal might be in the works - Tuesday's overnight session looked like they all were heading down..
The NQ and RUT both broke to the upside from their flags with the NQ leading a lonely charge up.
But the rest were basically sideways for the week.


November 11/07/2014 EOW
Combined tick and time for the 1st week...followed by combined daily charts.
The big guys moved up while the little guys flagged sideways.


October 10/30/2014 EOM
Quite a bit of movement over the recent two weeks - NQ hitting new all time highs with
the ES and YM just about there too. The RUT has done a lot of catching up.
4 hour per bar and daily charts


October 10/17/2014 EOW
Led by the RUT, the markets managed to bottom mid-week...
The RUT is back up to its April lows, the rest are back to or above their August lows...
Second week - combined 1 hour and daily charts...


October 2014 EOW
Second week session charts - the trend was down!

 The 1 hour candles for the week:


October 2014 EOW
First week session charts...ending about where we started...

 6 month dailies - continuous contract


September 2014 EOM
4 hour charts for the month - they don't really capture the magnitude of the pull back from the highs of August...

 Dailies with new channels drawn

September 2014 EOW...4th week
Unfortunately I forgot the 3rd week charts...the session charts below cover 2 weeks...


Bullish daily chart patterns following two weeks of up-and-down price action:
ES & YM Mega-phones, also closing above their over-under lines
 The RUT formed a double bottom, hopefully new support...the NQ broke down out of its channel but closed back in it...

September 2014 EOW...2nd week
With contact roll-over on Thursday, tick charts are not populated...Here are the 1 hour charts


September 2014 EOW...1st week
5 session tick:


4 hour per bar:

 Daily:


AUGUST 29 2014 EOW and EOM
First the 5 session tick charts for the last week in August...the FUTs spent the week in relatively narrow ranges

 But the 4 hour per bar charts for the entire month show the strong rallies/recoveries, trending up for the last three weeks...

 Short term daily charts...

AUGUST 23 2014 EOW...3rd week
Five session tick and hourly charts combined...for the third week of August.
The NQ, ES and YM printing up trends all week. The RUT has been a bit choppy...

 Daily charts thru the 3rd week of August...the RUT is seriously lagging...


AUGUST 15 2014 EOW
Trended up all week albeit on low volume until Friday - the increased activity is shown by the distances
between the session open/MMO open vertical lines (a greater number of bars printed on Friday).
Session charts for the second week of August:

 1 hour chart sets show Friday's volatility better than the session sets:

 The Dailies to date thru the second week in August:

 The session patterns for Friday each seem to almost mimic their respective daily patterns since July's top.
No significance is implied, just an observation that interests me)
December 12/31/2014 EOM
Ending the month with two down days...the YM and ES closing about where they started ...
The NQ closed lower while the RUT closed higher. All had mid-month swoons.
December 12/19/2014 EOW
Reversed last week's swoon with back-to-back long candles on Wednesday and Thursday.
One hour per bar for the week's sessions over the daily charts
December 12/12/2014 EOW
Trended down all week...This past Friday's close marks the week before OEX...
(12/15/2014 - Had to correct the arrow /date placement for the October turns)
December 12/05/2014 EOW
First/Last/Friday B4 OEX chart followed by the 5 day sessions and dailies...pretty much UNCH week-over-week...
(Note: the arrow placements for the turn in October are incorrect - see the corrected charts posted 12/15/2014 above)
November 11/28/2014 EOM
Trended up all month except for the RUT...
November 11/21/2014 EOW
ATHs are still printing except for the RUT...OEX week and there was a bit of volatility, especially Thurs-Fri...
Combined daily and 5-session charts for the 3rd week...
November 11/14/2014 EOW
Combined daily and 5-session charts for the 2st week...
I drew flags on the RUT & NQ and ascending wedges on the YM & ES, correlating to NR7 patterns that formed last Monday.
The NR7 was suggesting a reversal might be in the works - Tuesday's overnight session looked like they all were heading down..
The NQ and RUT both broke to the upside from their flags with the NQ leading a lonely charge up.
But the rest were basically sideways for the week.
November 11/07/2014 EOW
Combined tick and time for the 1st week...followed by combined daily charts.
The big guys moved up while the little guys flagged sideways.
October 10/30/2014 EOM
Quite a bit of movement over the recent two weeks - NQ hitting new all time highs with
the ES and YM just about there too. The RUT has done a lot of catching up.
4 hour per bar and daily charts
October 10/17/2014 EOW
Led by the RUT, the markets managed to bottom mid-week...
The RUT is back up to its April lows, the rest are back to or above their August lows...
Second week - combined 1 hour and daily charts...
October 2014 EOW
Second week session charts - the trend was down!
October 2014 EOW
First week session charts...ending about where we started...
September 2014 EOM
4 hour charts for the month - they don't really capture the magnitude of the pull back from the highs of August...
September 2014 EOW...4th week
Unfortunately I forgot the 3rd week charts...the session charts below cover 2 weeks...
Bullish daily chart patterns following two weeks of up-and-down price action:
ES & YM Mega-phones, also closing above their over-under lines
September 2014 EOW...2nd week
With contact roll-over on Thursday, tick charts are not populated...Here are the 1 hour charts
September 2014 EOW...1st week
5 session tick:
AUGUST 29 2014 EOW and EOM
First the 5 session tick charts for the last week in August...the FUTs spent the week in relatively narrow ranges
AUGUST 23 2014 EOW...3rd week
Five session tick and hourly charts combined...for the third week of August.
The NQ, ES and YM printing up trends all week. The RUT has been a bit choppy...
AUGUST 15 2014 EOW
Trended up all week albeit on low volume until Friday - the increased activity is shown by the distances
between the session open/MMO open vertical lines (a greater number of bars printed on Friday).
Session charts for the second week of August:
No significance is implied, just an observation that interests me)


AUGUST 8 2014 EOW
The 5 session and 5 day charts for the first week of August:


AUGUST 1 2014 EOM
4 hour/bar for the month -YM & ES dropped month-over-month in the last week.
NQ about where it started the month and the RLM has been dropping all month.


JULY 25 2014 EOW
5 session tick charts through 7/25/2014 showing the relative change week-over-week


Daily charts through 7/25/2014

Daily - longer term


JULY 18 2014 EOW
Just about unchanged week over week except for the RUT which has been pretty much going it's own way of late.
Thursday's down move came on higher volume/activity...reversed almost completely on Friday.
5 session tick charts


1 hour candles for the 5 days


Interesting how out of sync the RUT has been...retracing the run from April thru June and into the Brach Zone


JULY 11 2014 EOW
This week followed the Independence Day holiday which included shortened sessions for Thursday and Friday.
Mostly down this week but recovered a lot of the losses by week's end - except for the RUT...
First sets are the 5 session tick charts


And the 1 hour bar charts through 7/11/2014


Daily charts through 7/11/2014


JUNE 27 2014 EOW
I missed the summaries last week so I'm doing 2 week charts.
3rd and 4th week of June...10 session tick charts
Looks as if the YM+NQ patterns are mirror images while the ES+RLM patterns are in sync...
The YM appears to be lagging the bunch.


3rd and 4th week of June - 2 hour charts:


4 th week of June - YM daily:


JUNE 13 2014 EOW
2nd week of June...5 session tick charts
Volume transferred to the Sept contracts thus the last day tick volume was light on the June contracts shown...
Making new all time highs early in the week before giving some back.


JUNE 6 2014 EOW
1st week of June
5 session tick charts


2014 YTD - Daily, Weekly, MONTHLY
ADD'l Charts - through May
Using ETFs as proxies for their respective Indices and Futures because my futures data does not go back far enough...
Comparing trend lines spanning approximately 1 year. 2-3 years and 5+ years since 2009's low.


May 2014 EOM
4 hour charts spanning May's activity...The four Futures markets I follow were all up from April's levels...
So much for "Sell in May and go away" this year.


nicely from April's low but the RLM is lagging...
Stochastics show that all are over-bought and due for a correction to start June off...


May 2014 EOW
4th week of May
5 session tick charts


ETF as proxies for their indices - Dailies followed by Weeklies...
Comparing price action since JAN/FEB's lows, the YM and ES pretty much held the line while the Q's and IWM sold off thru APR/MAY...
The QQQ has recovered nearly all its drop. Perhaps the IWM/Russel 2000 might be a better play if you're summer-rally-bullish...
I'm thinking the markets are anticipating a government sea change this November...Out with the liberal anti-capitalist government
of the past 6 to 8 years...America seems to be getting fed up with their idiot socialist agenda games...
If there is to be a summer rally this year it may run thru the elections


May 2014 EOW
3rd week of May
5 session tick charts


May 2014 EOW
2nd week of May
5 session tick charts


May 2014 EOW
1st week of May
Friday's patterns: bullish wedges in 3 of 4 markets (5 wave?)...the NQ is doing its own thing.


April 2014 EOM
4 hour bars spanning April. The YM, ES and NQ basically unchanged since March with the RUT down a bit...


April 2014 EOW
4th week of April...mostly sideways until Friday...
First the DOW followed by the ETF index proxies showing what happened this week.


4 th week of April...60 minute over tick charts for comparing the 5 days...


4 th week of April...Daily futures charts

April 2014 EOW
3rd week of April...short week due to Good Friday.
Nice retrace back to last week's highs in the DOW - took 2 days to sell off and all 4 days of this week to recover.


3rd week of April minute based


The ETF proxies for the 3rd week of April

April 2014 EOW
2nd week of April
Coming off last week's decline the FUTs rallied Mon-Tues but were not able to reach their Brach Zone retrace levels before dropping further Thurs-Fri.

to the indicator divergences or if Friday was just a pause in a bigger drop to come.


April 2014 Add'l charts
Just found the differences between Leaders/Laggards interesting...
4 sets of 2 charts each, roughly 2 weeks of sessions followed by 3 month dailies.
If these are leading...


Does not dropping as much or as fast count as leading?
Since March, The NQ & RLM printed LL's and LH's, the very definition of downtrends...


1st week of April
Mixed week with the ES and YM ending slightly above last week, NQ and RLM slightly below...
Friday was a very active day relative to the rest of the week.


March 2014 EOM
4 hour bars spanning March. Not much change since February except for the NQ...


March 2014 EOW
3/28/2014 Last week/month
Lots of movement for the week but ended up about where we started, at least in the DOW and S&P.
On Wednesday there was news of a very large options/futures trade that spooked the markets.
Turned out to be a 'neutral' positioning transaction but you can see the nervousness that exists...
Tick chart pairs first followed by the 1 hour and 5 min pairs...


3/21/2014 3rd week March


3/14/2014 2nd week March


2nd week March - ETFs as proxies for the FUTs...30 minute over daily

3/7/2014 1st week March


February 2014 EOM


February 2014 EOW
2/28/2014 last week/month


