Mar 2016 Trade Statistics and activity


The charts below are my trades for the entire month.
The tick Gain/Loss numbers and net dollar amounts have been adjusted to show just 1 contract for each trade.
The charts usually combine what I saw as entry rationals and another for the results of that trade.
Often I'll include a chart of what happened after the trade was closed. (All of my stop-outs are not included)
A summary of result statistics are included above the 1st trade chart of each day:
Day & Date ... Winning / Losing / Break-even ... tick Gain/Loss and Net Dollar amount (after commissions)
***************************************************
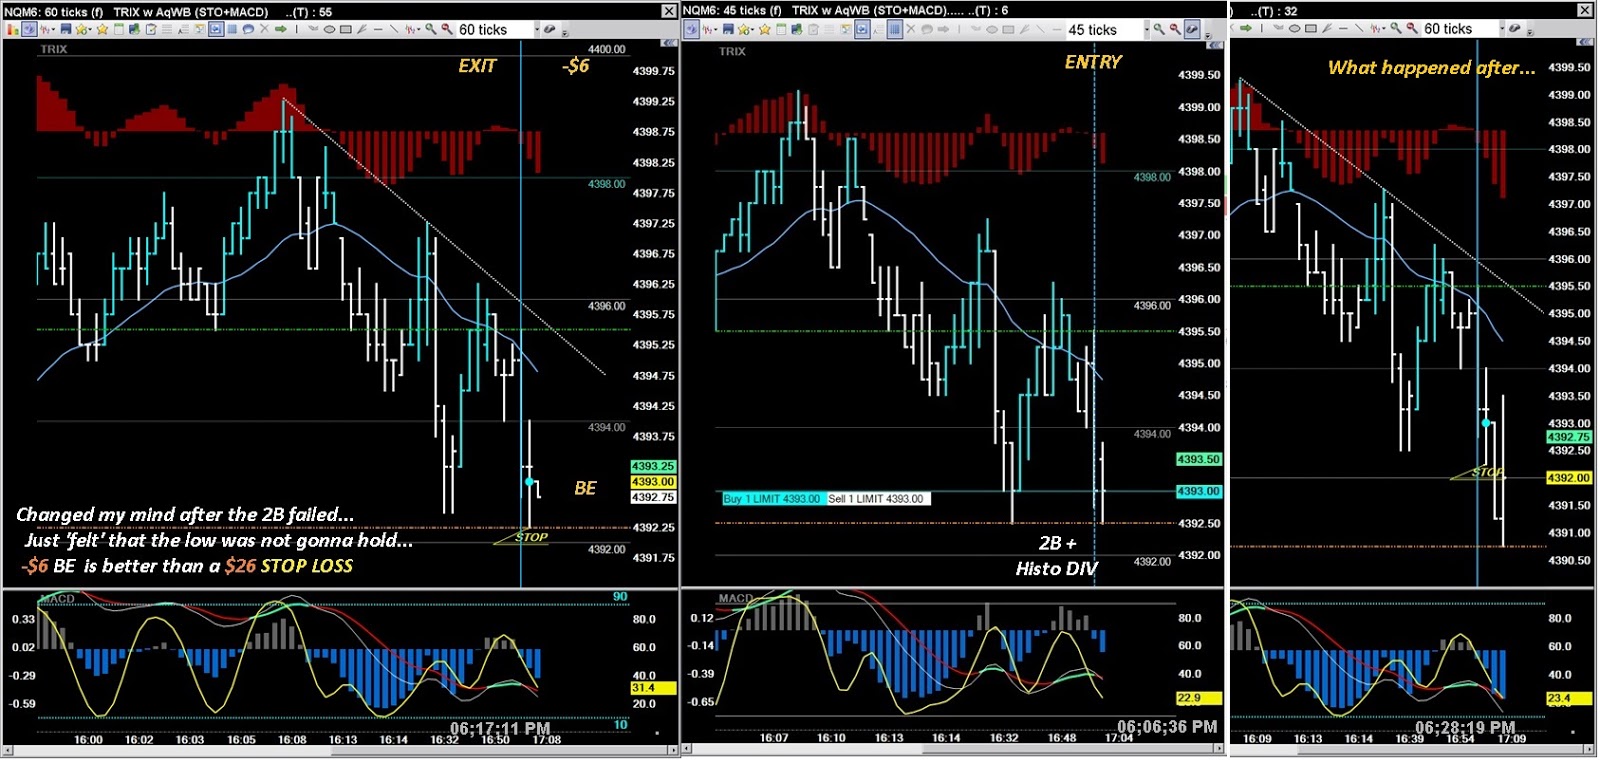
03/31/2016 Thursday (Wednesday night)...1/1/0...+3 or +$26
Ideas don't always work out...
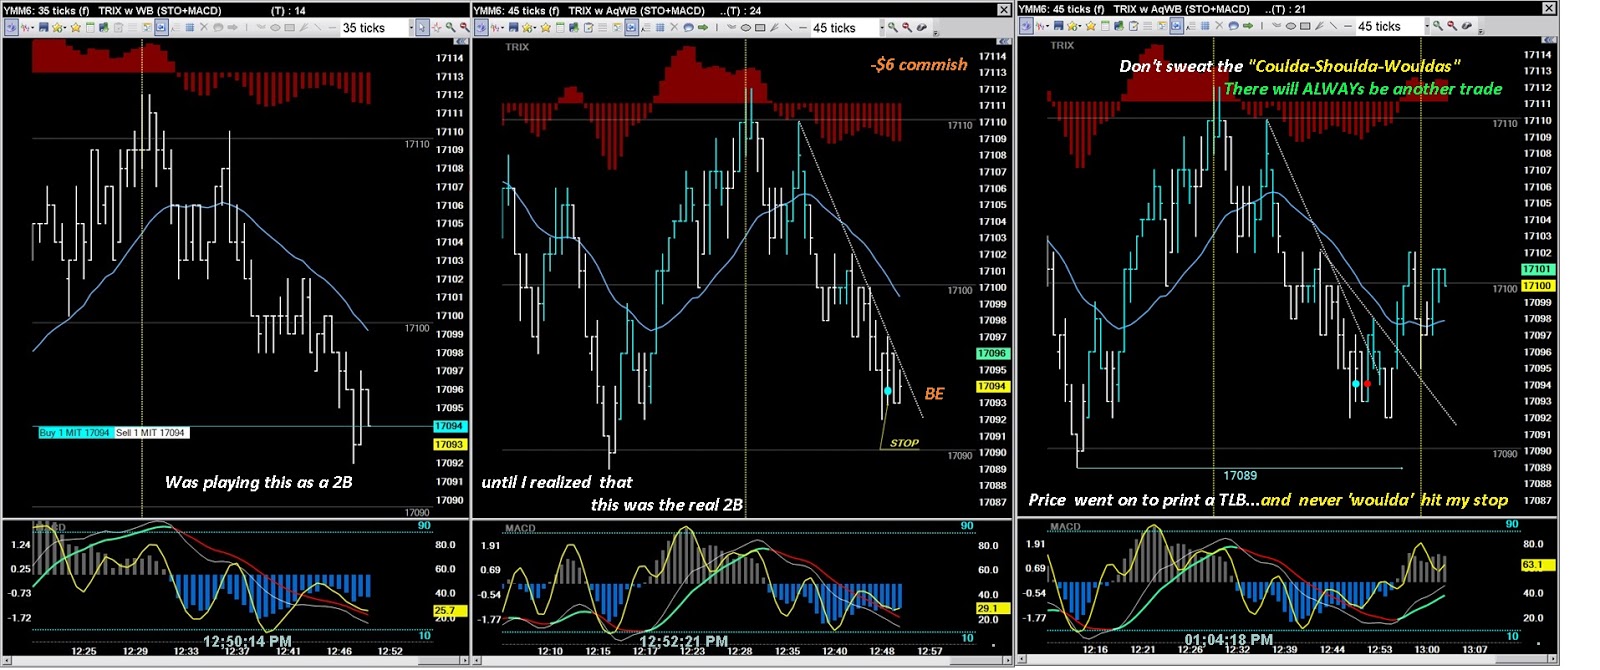
 Sometimes ideas work differently than you envisioned...Took a VERY long time...Turns out the 2nd leg was the trade to take.

03/30/2016 Wednesday...1/2/1...+4 or +$36 (including Tuesday night)


03/29/2016 Tuesday...1/0/0...+17 or +$79

03/28/2016 Monday...1/3/2...-4 or -$56
Ideas don't always work out...


03/30/2016 Wednesday...1/2/1...+4 or +$36 (including Tuesday night)


03/29/2016 Tuesday night...01/0...-4 or -$26

03/29/2016 Tuesday...1/0/0...+17 or +$79

03/28/2016 Monday...1/3/2...-4 or -$56


Finally caught a win but it didn't run either.

03/24/2016 Thursday...0/3//0...-10 or -$74
Good signals failed


It seems I'm a little off today; stops and missed fills defining my day...

Thursday's session on Wednesday night...
I don't like using the previous session's price action, patterns or trend lines to rationalize an entry
into the new session...There are better trades with better chances for success.
.
03/23/2016 Wednesday...2/1/0...+20 or +$84 (includes Tuesday night)


Wednesday's session on Tuesday night...1/0/0...+16 or +$74
Very low VOL and slow trading in the early hours of the new session but it doesn't matter - P/A is P/A at any time...

Tuesday 03/22/2016...2/2/0...+23 or +$91


Monday 03/21/2015...2/1/1...+17 or +$61 (includes Sunday night)

Below I was focused on a 'perfect' 2B forming and missed an entry. Next time, try to use a higher limit for entry
so that the initial stop would be below the 2B level , thus counting on a 'perfect' 2nd leg low as support.


Multiple time frames all suggested a trade entry...

This trade was really a WAG based on my "FEEL" and on the stochastic, using four different charts.
STO position on the 35T and 45T charts shown above plus the 1 minute and 60T charts shown below...

Sunday night 03/20/2016...

This shows my rational for the entry above...there was nothing other than an O/S stochastic on the T-mode charts
but the time based charts were hammering out long lower shadows as price came off the LOD.
The anticipated reversal did happen but it definitely was a WAG trade...

Friday 03/18/2016...1/2/0... -5 or -$41


Thursday 03/17/2016...1/0/0...+10 or +$44

Wednesday 03/16/2016 ... no trades
Tuesday 03/15/2016...1/0/1...+12 or +$48

Monday 03/14/2016...4/1/2...+50 or +$213


Sunday night

Friday 03/11/2016...3/0/0...+11 or +$47


Thursday night 03/10/2016...

Thursday 03/10/2016...3/1/0...+39 or +$171


Wednesday 03/09/2016...3/1/2...+25 or +$89
Four trades before the majors opened - up but not especially successful ...


Lunch time...
Price is still not running up to 12 tick initial target after entry....

Took less than initial bracketed target...

Tuesday 03/08/2016...3/0/1...+53 or +$240


Ya gots to pay attention to take the bacon home.

There IS and ALWAYS will be another trade

Monday 03/07/2016...2/0/0...+48 or +$228


Friday 03/04/2016...3/0/0...+54 or +$274
Good signals but I lost confidence in it continuing to run...

Not so good signals but it worked out great...

The old spotter chart trick...

Thursday 03/03/2016...2/1/0...+10 or +$33

2 trades net +14 or +$58

Wednesday 03/02/2016...1/0/0...+23 or +$109

Tuesday 03/01/2016...3/1/1...+18 or +$186 (includes Monday night)


Monday night...02/29/2016
